Let’s Get Visual-Bring Infographics into Your Marketing Strategy
In 1921, a man named Fred R. Barnard said, “A picture is worth a thousand words,” as he promoted the use of images in ads that appeared on the sides of streetcars. It’s hard to dispute that statement, especially in today’s world where images are published, posted, and snapped (Snapchat) across America.
Did you know that 90 percent of information transmitted to the brain is visual? It’s true! Images will enhance the messages you are trying to convey within your marketing and infographics and bring it all together in an impactful way.
An infographic is a graphic visual representation of information, data or knowledge intended to present complex information quickly and clearly. So, in this case, you can say, A good infographic is worth a thousand words.
Before you make an infographic, ask yourself these questions:
- What is your goal?
- How much data or text do you have to include?
- What is the main message you want to convey?
Now, determine what TYPE of infographic will best serve your purpose. Here are just a few examples:
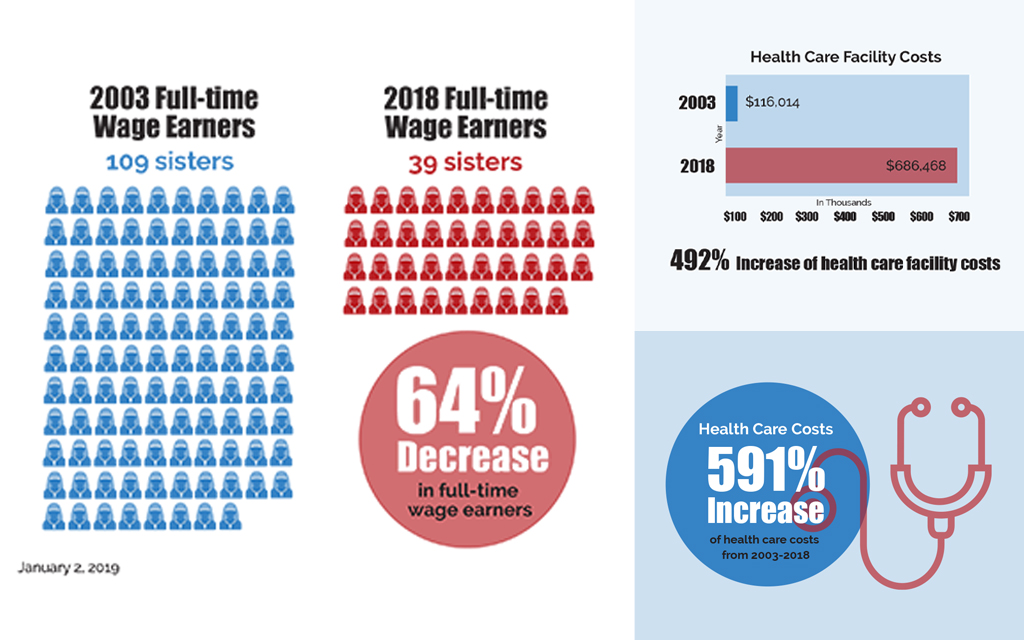
- Data Visualizations – also called Data Vis or Number Crunch – these are the most used types online! Utilizes cool graphics to paint pictures that focus on the data.
- Photo – photo that includes text to drive the user. These are very common on social media or headers of websites.
- Visualized Article – This takes an otherwise lengthy and wordy piece of writing and makes it visual.
- Useful Bait – A way to explain something or answer a question visually. Usability over design is the key to this one. It needs to be in a printable format so it can be referenced over and over!
- Versus – Compare two things side by side to allow you to see their ‘visual’ differences.
Published on: May 5, 2015